Launching the #CPUOverload Project: Testing Every x86 Desktop Processor since 2010
by Dr. Ian Cutress on July 20, 2020 1:30 PM ESTCPU Tests: Rendering
Rendering tests, compared to others, are often a little more simple to digest and automate. All the tests put out some sort of score or time, usually in an obtainable way that makes it fairly easy to extract. These tests are some of the most strenuous in our list, due to the highly threaded nature of rendering and ray-tracing, and can draw a lot of power. If a system is not properly configured to deal with the thermal requirements of the processor, the rendering benchmarks is where it would show most easily as the frequency drops over a sustained period of time. Most benchmarks in this case are re-run several times, and the key to this is having an appropriate idle/wait time between benchmarks to allow for temperatures to normalize from the last test.
Blender 2.83 LTS: Link
One of the popular tools for rendering is Blender, with it being a public open source project that anyone in the animation industry can get involved in. This extends to conferences, use in films and VR, with a dedicated Blender Institute, and everything you might expect from a professional software package (except perhaps a professional grade support package). With it being open-source, studios can customize it in as many ways as they need to get the results they require. It ends up being a big optimization target for both Intel and AMD in this regard.
For benchmarking purposes, Blender offers a benchmark suite of tests: six tests varying in complexity and difficulty for any system of CPUs and GPUs to render up to several hours compute time, even on GPUs commonly associated with rendering tools. Unfortunately what was pushed to the community wasn’t friendly for automation purposes, with there being no command line, no way to isolate one of the tests, and no way to get the data out in a sufficient manner.
To that end, we fell back to one rendering a frame from a detailed project. Most reviews, as we have done in the past, focus on one of the classic Blender renders, known as BMW_27. It can take anywhere from a few minutes to almost an hour on a regular system. However now that Blender has moved onto a Long Term Support model (LTS) with the latest 2.83 release, we decided to go for something different.

We use this scene, called PartyTug at 6AM by Ian Hubert, which is the official image of Blender 2.83. It is 44.3 MB in size, and uses some of the more modern compute properties of Blender. As it is more complex than the BMW scene, but uses different aspects of the compute model, time to process is roughly similar to before. We loop the scene for 10 minutes, taking the average time of the completions taken. Blender offers a command-line tool for batch commands, and we redirect the output into a text file.
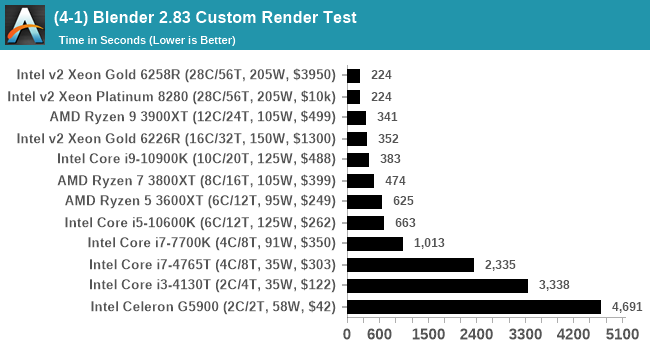
As this is a time to complete benchmark, as we strap in the big multi-core projects, those bars will shrink a lot. But there are still a couple of minutes to shave off!
Corona 1.3: Link
Corona is billed as a popular high-performance photorealistic rendering engine for 3ds Max, with development for Cinema 4D support as well. In order to promote the software, the developers produced a downloadable benchmark on the 1.3 version of the software, with a ray-traced scene involving a military vehicle and a lot of foliage. The software does multiple passes, calculating the scene, geometry, preconditioning and rendering, with performance measured in the time to finish the benchmark (the official metric used on their website) or in rays per second (the metric we use to offer a more linear scale).
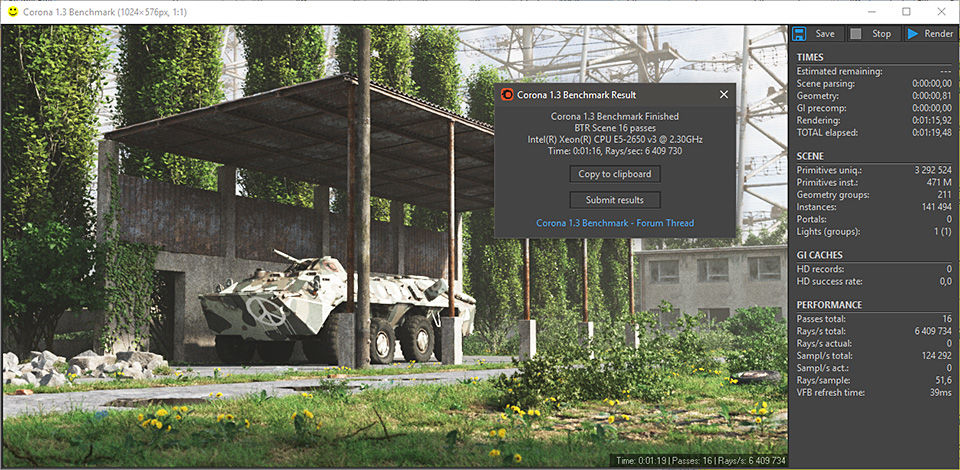
The standard benchmark provided by Corona is interface driven: the scene is calculated and displayed in front of the user, with the ability to upload the result to their online database. We got in contact with the developers, who provided us with a non-interface version that allowed for command-line entry and retrieval of the results very easily. We loop around the benchmark five times, waiting 60 seconds between each, and taking an overall average. The time to run this benchmark can be around 10 minutes on a Core i9, up to over an hour on a quad-core 2014 AMD processor or dual-core Pentium.
One small caveat with this benchmark is that it needs online access to run, as the engine will only operate with a license from the licensing servers. For both the GUI and the command-line version, it does this automatically, but it does throw up an error if it can’t get a license. The good thing is that the license is valid for a week, so it doesn’t need further communications until that time runs out.

Corona for use with 3ds Max is on version 1.7, rather than the version 1.3 that the benchmark is currently on. We are told that there are some minor improvements to performance, and a newer benchmark will be produced at some point in the future. One of the benefits of an older benchmark in this case is should a budding reverse engineer actually pull out the Corona libraries to use without a license.
Crysis CPU-Only Gameplay
One of the most oft used memes in computer gaming is ‘Can It Run Crysis?’. The original 2007 game, built in the Crytek engine by Crytek, was heralded as a computationally complex title for the hardware at the time and several years after, suggesting that a user needed graphics hardware from the future in order to run it. Fast forward over a decade, and the game runs fairly easily on modern GPUs.
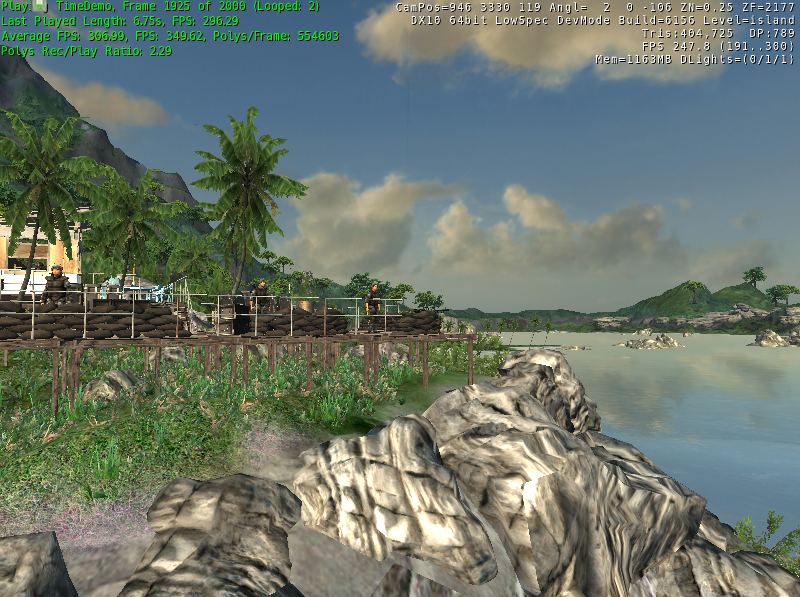
But can we also apply the same concept to pure CPU rendering? Can a CPU, on its own, render Crysis? Since 64 core processors entered the market, one can dream. So we built a benchmark to see whether the hardware can.
For this test, we’re running Crysis’ own GPU benchmark, but in CPU render mode. This is a 2000 frame test, with low settings. Initially we planned to run the test over several resolutions, however realistically speaking only 1920x1080 matters at this point.

We’re seeing some regular consumer CPUs pull into the double digits! Unfortunately our Xeon system didn’t want to run the Crysis test at all, so it will get interesting as we move to the big AMD silicon.
POV-Ray 3.7.1: Link
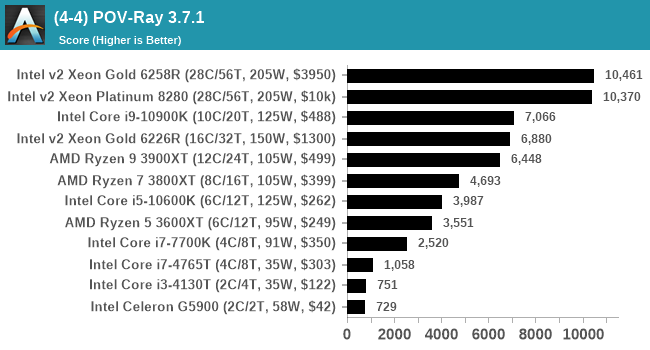
A long time benchmark staple, POV-Ray is another rendering program that is well known to load up every single thread in a system, regardless of cache and memory levels. After a long period of POV-Ray 3.7 being the latest official release, when AMD launched Ryzen the POV-Ray codebase suddenly saw a range of activity from both AMD and Intel, knowing that the software (with the built-in benchmark) would be an optimization tool for the hardware.
We had to stick a flag in the sand when it came to selecting the version that was fair to both AMD and Intel, and still relevant to end-users. Version 3.7.1 fixes a significant bug in the early 2017 code that was advised against in both Intel and AMD manuals regarding to write-after-read, leading to a nice performance boost.

The benchmark automation uses the BENCHMARK flag that runs the built-in multi-threaded tests and dumps the results into the clipboard. This is a full text dump, and so the actual score needs to be parsed through a quick regex check, then multiple runs can be put together to find an average. Watching the benchmark shows the result as it is being processed, however the score is an average of the processing for the last X number of seconds – the benchmark starts fast, then slows down, and speeds up towards the end, likely due to the complexity of the scene being rendered as it progresses.
The benchmark can take over 20 minutes on a slow system with few cores, or around a minute or two on a fast system, or seconds with a dual high-core count EPYC. Because POV-Ray draws a large amount of power and current, it is important to make sure the cooling is sufficient here and the system stays in its high-power state. Using a motherboard with a poor power-delivery and low airflow could create an issue that won’t be obvious in some CPU positioning if the power limit only causes a 100 MHz drop as it changes P-states.
We also use POV-Ray as our load generator in our per-core power testing. For this we take the benchmark.pov file and force it to render at an 8K resolution, which requires several minutes even on a dual socket EPYC system. Then we take the power measurement 60 seconds into the test.
V-Ray: Link
We have a couple of renderers and ray tracers in our suite already, however V-Ray’s benchmark came through for a requested benchmark enough for us to roll it into our suite. Built by ChaosGroup, V-Ray is a 3D rendering package compatible with a number of popular commercial imaging applications, such as 3ds Max, Maya, Undreal, Cinema 4D, and Blender.
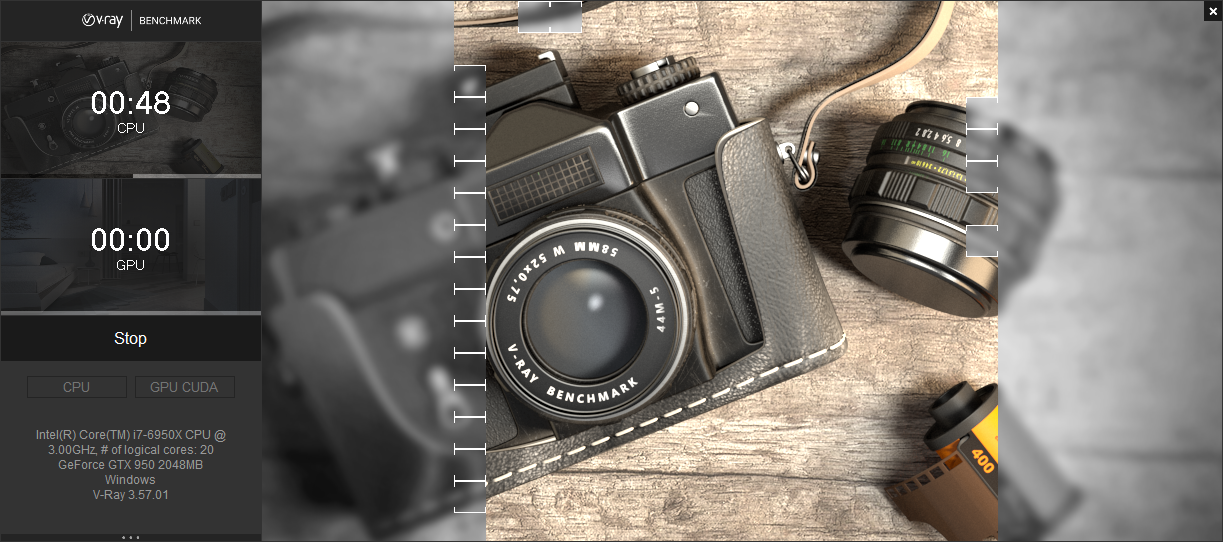
We run the standard standalone benchmark application, but in an automated fashion to pull out the result in the form of kilosamples/second. We run the test six times and take an average of the valid results.
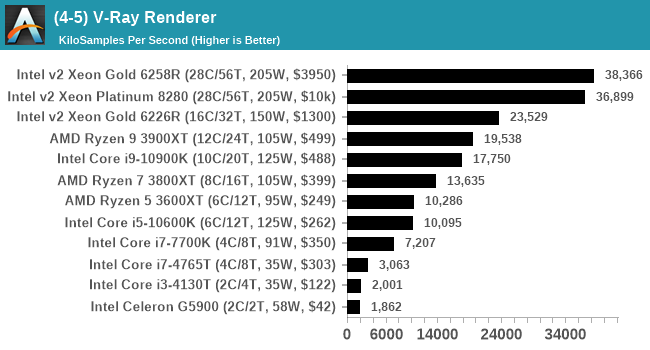
Nothing much to say here, as it seems to scale quite well.
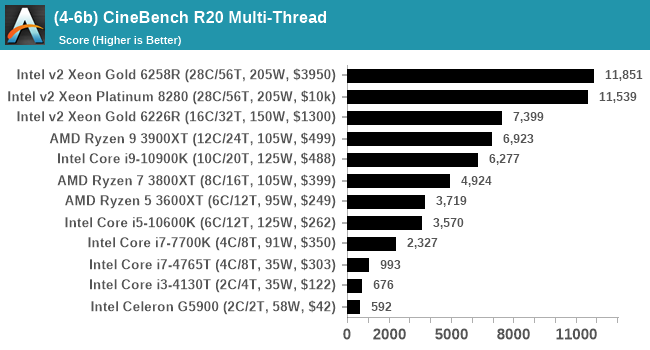
Cinebench R20: Link
Another common stable of a benchmark suite is Cinebench. Based on Cinema4D, Cinebench is a purpose built benchmark machine that renders a scene with both single and multi-threaded options. The scene is identical in both cases. The R20 version means that it targets Cinema 4D R20, a slightly older version of the software which is currently on version R21. Cinebench R20 was launched given that the R15 version had been out a long time, and despite the difference between the benchmark and the latest version of the software on which it is based, Cinebench results are often quoted a lot in marketing materials.
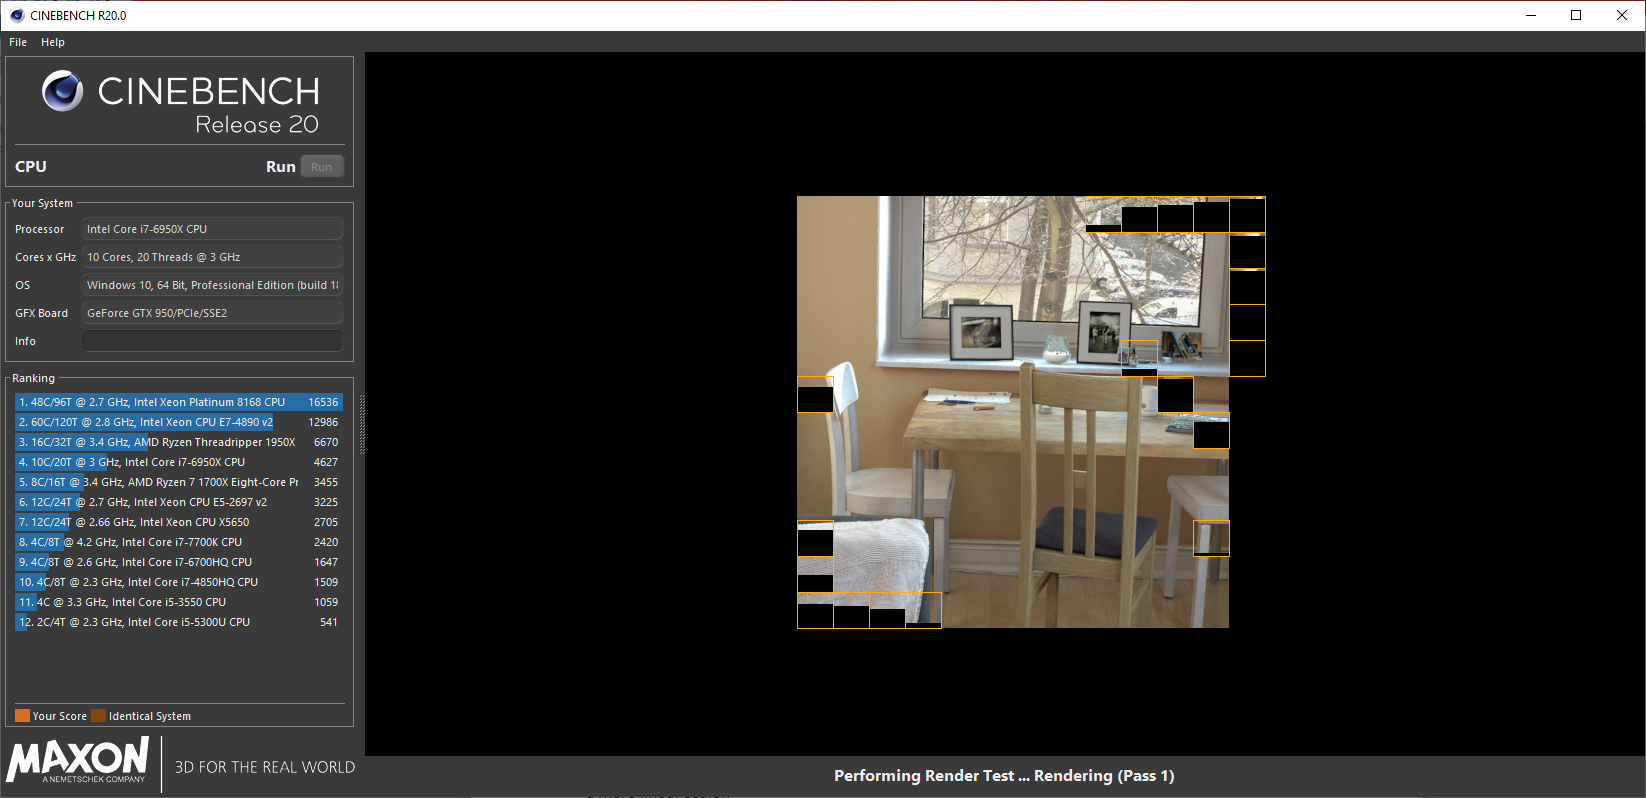
Results for Cinebench R20 are not comparable to R15 or older, because both the scene being used is different, but also the updates in the code bath. The results are output as a score from the software, which is directly proportional to the time taken. Using the benchmark flags for single CPU and multi-CPU workloads, we run the software from the command line which opens the test, runs it, and dumps the result into the console which is redirected to a text file. The test is repeated for 10 minutes for both ST and MT, and then the runs averaged.
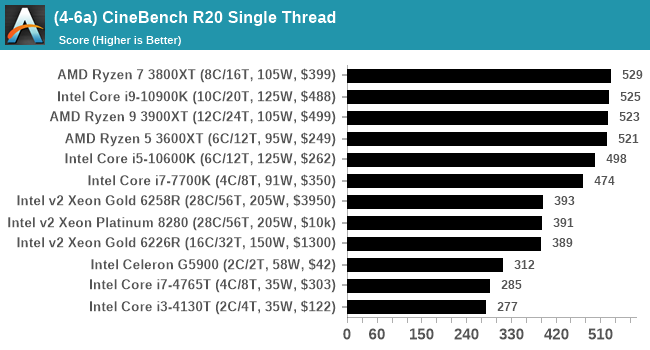
Cinebench R20 in single threaded mode is often used as a good example for IPC performance. Cinebench does not often tax the main memory or the storage, meaning that the base core design and cache structure play an important part in performance. It is one metric that Intel used to love to show its dominance over AMD, however since AMD launched Ryzen, R20 is now in AMD’s wheelhouse and Intel actively promotes it as a non-real-world benchmark.
The multi-threaded test is also somewhat DRAM and storage agnostic, showing how lots of threads can get a high result. One of the limits of R15 is that it would max out at 64 threads, then be inconsistent in performance. The R20 test is built to be a lot longer, but uses the same threading approach as before – spawn a number of worker threads equal to the CPU threads in the system, and then send batches of work to each thread rather than killing and respawning them. This means there is no overhead due to thread generation.


110 Comments
View All Comments
DiHydro - Monday, July 20, 2020 - link
This is epic. Thank you for doing this.DiHydro - Monday, July 20, 2020 - link
To add a note: I think the ~$300 CPU year-over-year performance would be an interesting metric to see. That price point seems to be pretty popular for enthusiasts, and seeing back 5-6 years how that performance has increased per dollar would be neat.bldr - Monday, July 20, 2020 - link
Agree!close - Monday, July 20, 2020 - link
It will be especially interesting to see those CPUs (the popular mainstream ones) tested now and compared to the numbers they got originally to see how much they lost with all the recent mitigations.close - Tuesday, July 21, 2020 - link
Oh, because I forgot previously, congratulations and good luck with the endeavor! I got exhausted only by reading about the work you're going to have to doFozzie - Monday, July 20, 2020 - link
Except keep in mind that adjusted for inflation $200 in the year 2000 is worth over $300 now.You'd either be making a chart of the increased value over time just due to inflation or in fact the every increasing value at the $300 price point due to the reduced value of the Dollar on top of whatever performance gains occurred.
biosstar - Friday, July 24, 2020 - link
You could also use the value of a dollar in a certain year (let's say 2020) and compare the processors in the inflation adjusted equal categories.PeterCollier - Monday, July 20, 2020 - link
What's the point of this Geekbench/Userbenchmark knockoff? I've never used AT's Bench tool. Especially not for smartphones, since the Bench tool is about 5 years out of date.BushLin - Monday, July 20, 2020 - link
A controlled environment across all tests is reason enough. Even if I don't agree with AT policy on what speed they allow RAM to operate, it is a fair comparison.Byte - Monday, July 20, 2020 - link
RAM is a really important topic. I think at this point in time, we can reasonable put almost maxed out ram for every platform. Like DDR3 can run at 2133, DDR4 we can run it at 3200 as prices are so close.It is like rating sports cars but all have Goodride tires on them.
A dodge viper was a widowmaker when it came out. Today with a good set of summers like PS4S or PZero, you will have a hard time slipping even if you tried.