
The Effect of Spray Parameters on the Survival of Bacteriophages


Centre for Food Safety, Department of Food Science, Stellenbosch University, Stellenbosch 7600, South Africa
*
Author to whom correspondence should be addressed.
Processes 2022, 10(4), 673; https://doi.org/10.3390/pr10040673
Submission received: 25 February 2022
/
Revised: 18 March 2022
/
Accepted: 21 March 2022
/
Published: 30 March 2022
Abstract
:There have been numerous studies highlighting the efficacy of various bacteriophages (phages) and phage cocktails in the reduction of pathogens in food. Despite approval from legislative bodies permitting phage use in food processing environments, applied via spray or dip, there is still no information on which spray parameters should be used for successful implementation. The study here investigates phage survival diluted to 1% in distilled water (dH2O) and prepared bottled water (PBW), followed by a subsequent spray application through a fixed nozzle (530 μm) and strainer size (74 × 74 μm), with pressures of 3, 5, and 6 Bar. The survival of the phage was determined through sampling the outputs of the spray system and performing double agar overlay plaque assays. PBW decreased the phage concentration (p = 0.18) more than the dH2O (p = 0.73) prior to spray application. It was found that the PBW phage solution was less affected by the various spray parameters (p = 0.045) than the dH2O (p = 0.011). The study showed that unchlorinated water (dH2O), as well as a pressure of 3 Bar, had the highest output phage concentration through the nozzle and strainer, providing valuable information for industrial implementation.
1. Introduction
Bacteriophages (phages) have shown a lot of potential in reducing the incidence of foodborne pathogens on food; in fact, phages have shown great promise in fulfilling the need for biocontrol agents effective against multi-drug and/or multi-chemical resistant bacteria [1,2,3].
The growing global population places immense pressure on the food chain to meet the demand for enough food, but not only enough food—enough safe food [4]. This means that food companies have had to continuously reinvent (and survey) their food safety management systems to curb the resistance of bacteria specific to their food products and food processing environments [3]. The contamination of food with antibiotic-resistant bacteria (ARB) is an urgent public health concern as the methods of treatment for foodborne illness have become ineffective [5].
Phages have become the more appealing prospective method of food pathogen control at different phases throughout the production of food. This is largely due to their host-specificity. The United States Food and Drug Administration (US FDA, Washington, DC, USA) has approved several individual phages and phage cocktails for commercial use against various pathogens, such as SalmoFresh® and PhageGuard STM (PGS). Furthermore, many studies have confirmed the high efficacy of various commercial phage cocktails on food and food products in the laboratory setting, highlighting the potential for industrial-level application [6,7,8].
In terms of application methods, Yeh et al. [9] carried out a study where a dilution of PGS was added during the tumbling of red meat trim and poultry meat, before the grinding step. While Huang et al. [10] added a phage solution directly into milk, and Ahmadi et al. [11] added a phage solution into a meat slurry—all of which saw a reduction in microbial numbers. The US FDA [12] as well as Health Canada [13] have stipulated that phage can be applied as a processing aid via dip or spray, but, to the knowledge of the authors, there are no studies that provide guidance on parameters for a suitable industrial spray application system.
Reinhard et al. [14] used a commercially available hand-held sprayer (Braber Equipment Ltd. Abbotsford, BC, Canada) to apply PhageGuard ListexTM into a processing environment but did not mention the effect of the spray parameters on the phage efficacy. Soffer et al. [15] performed a study where ShigaShieldTM was applied using a Basic Spray Gun Model #250 (Badger Air-brush Co., Franklin Park, IL, USA), but did not elaborate on any preliminary information on whether the efficacy of the phage cocktail was affected by the spray gun itself.
Water content plays an integral role in phage efficacy—particularly water containing chlorine (generally after wastewater treatment). This is demonstrated by Sukumaran et al. [16], who highlight that chlorine-containing chemicals can inactivate phages.
The study presented here firstly investigates the combined effect of pressure, strainer, and nozzle diameter (collectively causing extrusion) on phage survival of a commercial cocktail of phages FO1a and S16 (PhageGuard STM—PGS, Wageningen, The Netherlands) diluted to 1% using prepared bottled water (PBW). It secondly investigates phage survival through the same spray parameters but with a 1% PGS solution prepared using distilled water (dH2O). This investigation seeks to provide insight for food companies to implement phage technology in a way that allows for the machinery to be adaptable to their specific environment.
2. Materials and Methods
2.1. Spray Machine Parameter Selection
Testing for phage survival involved preparing a 1% dilution (≈2 × 10⁹ PFU/mL) of PGS with two water types—dH2O and PBW (containing 4 ppm chloride as seen in Table 1). The phage solution was then run through a demo spray system using different pressures (3, 5, and 6 Bar) with a constant nozzle and mesh size.
According to Hagens and Loessner [1], the average size of a phage is approximately 0.05 × 0.2 μm. Therefore, for all analyses it was decided that a larger mesh and subsequent nozzle size would be selected. A 200 mesh (74 µm × 74 µm) and nozzle diameter of 530 µm (nozzle #13082 (Spraying Systems Co., Pretoria, South Africa)) was selected. To the knowledge of the authors, there were no previous publications on the effect of pump type on phage survival, and so to minimize any adverse effects due to mechanical action, a 3-chamber diaphragm pump (Aquatec, Pretoria, South Africa) was selected.
2.2. PGS Diluted to 1% with Prepared Bottled Water
Firstly, it was investigated the stability of phages diluted to 1% in prepared bottled water (PBW) (Table 1) run through a workshop demo spray cabinet using the 200 mesh, 5.3 × 10⁻³ µm nozzle and pressures of 3, 5, and 6 Bar.
PGS (100%) (50 mL) was aseptically added to 4950 mL of PBW to create a 1% (v/v) dilution (≈2 × 10⁹ PFU/mL). Approximately 10 mL of the undiluted 100% PGS (≈2 × 10¹¹ PFU/mL) (sample 1.1) was transferred to a 50 mL sterile sample tube for the control; this was stored in the refrigerator (4 °C) immediately. The 5 L (1%) solution was inverted repeatedly to ensure uniformity before 25 mL of the 1% solution (sample 1.2) was transferred into a 50 mL sterile sample tube and stored at refrigeration temperature (4 °C) immediately.
The spray system was flushed with PBW to ensure the cleaning of debris and residues. The remaining 1% PGS solution was then hooked up to the spray system. The system was switched on and the pressure was adjusted to 6 Bar and allowed to run for 5 s to ensure the phage was running uniformly through the system. A 25 mL sample of the outlet spray (sample 1.3) was aseptically collected using a sterile 50 mL sample tube and refrigerated (4 °C).
The system was switched off, the 5 L bottle was shaken to allow for re-distribution of any phage that may have settled, and the process was repeated—however at 5 Bar. After allowing 5 s of spraying, another 25 mL sample of the outlet spray (sample 1.4) was aseptically collected using a sterile 50 mL sample tube and refrigerated (4 °C). This was all performed once more at a pressure of 3 Bar (sample 1.5). All the refrigerated samples were immediately titrated. This was performed in triplicate. The summary of samples and tests can be seen in Table 2.
2.3. PGS Titration and Renumeration
SM Buffer Preparation
Sodium chloride (5.85 g/L) (Merck, Darmstadt, Germany), 6.057 g/L Tris (VWR, Radnor, PA, USA) and 2.47 g/L magnesium sulphate heptahydrate (Merck, Germany) were dissolved in 750 mL dH2O (Lasec, Pretoria, South Africa). The pH was then adjusted to 7.5 by adding 1 M hydrochloric acid (Kimix, Pretoria, South Africa) using an eye dropper. The solution was made up to 1 L (pH = 7.5) and autoclaved for 20 min at 121 °C.
2.4. Luria Bertani (LB) Broth
Tryptic soy broth (10 g/L) (Merck, Germany), 5g/L of yeast extract (Biolab, Cape Town, South Africa) and 10 g/L of sodium chloride (Merck, Germany) were dissolved in 750 mL dH2O (Lasec, South Africa) using a magnetic stirrer. The pH of the solution was adjusted to 7.5 by adding sodium hydroxide (Merck, Germany) using an eye dropper, before being made up to 1 L (pH = 7.5). It was then autoclaved at 121 °C for 20 min and allowed to cool.
2.5. Luria Bertani (LB) Agar Plates for Titration of PGS
LB broth was prepared and 15 g bacteriological agar (1.5% (w/v)) (Biolab, South Africa) was added to the LB broth. It was then autoclaved at 121 °C for 20 min and cooled to 60 °C in an oven. LB agar (15 mL) was poured per plate in a laminar flow cabinet.
2.6. Luria Bertani (LB) Top Agar Plates for Titration of PGS
LB broth was prepared and 4 g (0.4%) of bacteriological agar (Biolab, South Africa) was added to the broth. It was autoclaved at 121 ° C for 20 min and allowed to cool to 50 °C for 1 h in an oven.
2.7. Salmonella: Propagation of Culture
The strain used for phage titration was Salmonella enterica serovar Enteritidis C StR (Micreos Food Safety, Amsterdam, The Netherlands). This strain is routinely used as the host strain for PGS titration and is named by Micreos Food Safety as “Se13”. A frozen glycerol stock culture of Se13 was received from Micreos Food Safety (The Netherlands) and stored at −18 °C.
Two XLD plates were prepared as per the manufacturer’s instructions (Oxoid, South Africa) in dH2O (Lasec, Pretoria, South Africa). In a bio-safety cabinet (Labotec, Pretoria, South Africa), the Se13 was streaked onto the XLD plates using sterile inoculation loops. The XLD plates were incubated at 30 °C overnight.
An individual colony was then taken from the XLD plates and streaked out onto four LB agar plates using sterile inoculation loops. The LB agar plates were incubated at 30 °C overnight.
2.8. Overnight Culture for Glycerol Stocks
LB broth (100 mL) was added to a 250 mL Erlenmeyer flask and sealed with aluminum foil. The Erlenmeyer flask along with 30 mL glycerol (100%) (Radchem, Cape Town, South Africa) was then autoclaved at 121 °C for 20 min and allowed to cool to 25 °C before use. A sterile inoculation loop was used to isolate a single colony from the LB agar plate and inoculate the 100 mL sterile LB broth. The Erlenmeyer was then covered once more using the sterile aluminum foil and incubated in a shaking incubator (200 rpm) at 30 °C for 16–18 h.
Sterile 100% glycerol (20 mL) (Radchem, South Africa) was aseptically added to 100 mL of the overnight culture, making the final glycerol concentration of the culture 15–20%. The Erlenmeyer was swirled thoroughly to ensure the glycerol and culture were mixed well. The solution was then placed into the fridge (4 °C) to cool completely and have a homogenous appearance.
A sterile pipette was used to transfer 1.5 mL of the homogenous solution to sterile 2 mL Eppendorf tubes. The Eppendorfs (glycerol stocks) were then stored at −20 °C until needed for titration.
2.9. Phage Enumeration via Titration of PGS Samples
For each sample (1.1–1.5), dilutions in SM buffer (a 10−2 dilution factor applied each time) were performed in duplicate, with the highest dilution (≈2 × 10³ PFU/mL) plated in duplicate on LB agar plates (Figure 1). This meant that each sample had four corresponding plates for enumeration.
A heating block (Techne, UK) was set to 43 °C with sterile 10 mL glass test tubes. Top agar (4 mL) at 50 °C was aliquoted using a sterile glass pipette into each test tube for the double agar overlay plaque assay.
SM buffer (990 µL) was aseptically transferred to Eppendorf tubes using a pipette. The 25 mL sample (1.1–1.5) tubes were removed from the refrigerator (4 °C) and vortexed. A dilution series was then completed in duplicate for each sample (1.1–1.5) using the SM buffer, to obtain a final phage concentration of ≈2 × 10³ PFU/mL per sample. The Eppendorf tubes were vortexed well and inverted multiple times in between dilutions.
To each of the tubes containing top agar, 100 µL of Se13 host overnight culture—taken from the freezer (–20 °C)—was added. The phage solution (≈2 × 10³ PFU/mL) was vortexed and inverted before 50 µL was aseptically added to the tubes containing top agar. The glass test tube was vortexed for 2 s, with extra caution to not cause bubbles before pouring the top agar onto an LB agar plate. The plate was moved in gentle figure-of-eight motions until the top agar was evenly distributed over the plate. The plates were then incubated overnight at 20 °C. This method was repeated for all samples and duplicates.
2.10. Phage Renumeration
Once incubated overnight, the plates were removed. The plaques on the plates were counted and the titer was calculated according to the following formula:
2.11. PGS Diluted to 1% with Distilled Water
PGS was then diluted to 1% using distilled water (dH2O) (Lasec, South Africa). The same spray parameter analyses and sampling used for the PGS with PBW were repeated in the same manner with PGS diluted using dH2O (Sample 2.1–2.5). The % survival was then calculated by dividing the calculated PFU/mL of each sample (1.2–1.5; 2.1–2.5) by the stock undiluted solution (samples 1.1 and 2.1) and multiplying by 100.
2.12. Statistical Analysis
Analyses were performed with one-way ANOVA to compare PFU/mL in the stock, in the 1% dH2O and PBW. The effects of 3, 5, and 6 Bar pressures on the 1% PGS PFU/mL (dH2O and PBW) were then subsequently compared using Fisher’s least significant difference (LSD) for multiple comparisons. These analyses were performed using STATISCA. Error bars were included with 95% confidence intervals. Differences among multiple treatments were indicated with lettering in the graphs as well as in the post hoc LSD multiple comparisons. If two treatment means differ significantly, the lettering is different, for example “a” and “b”. If they do not differ significantly there will be a common letter, such as “a” and “ab” or “a” and “a”.
3. Results
3.1. PGS Diluted to 1% with PBW
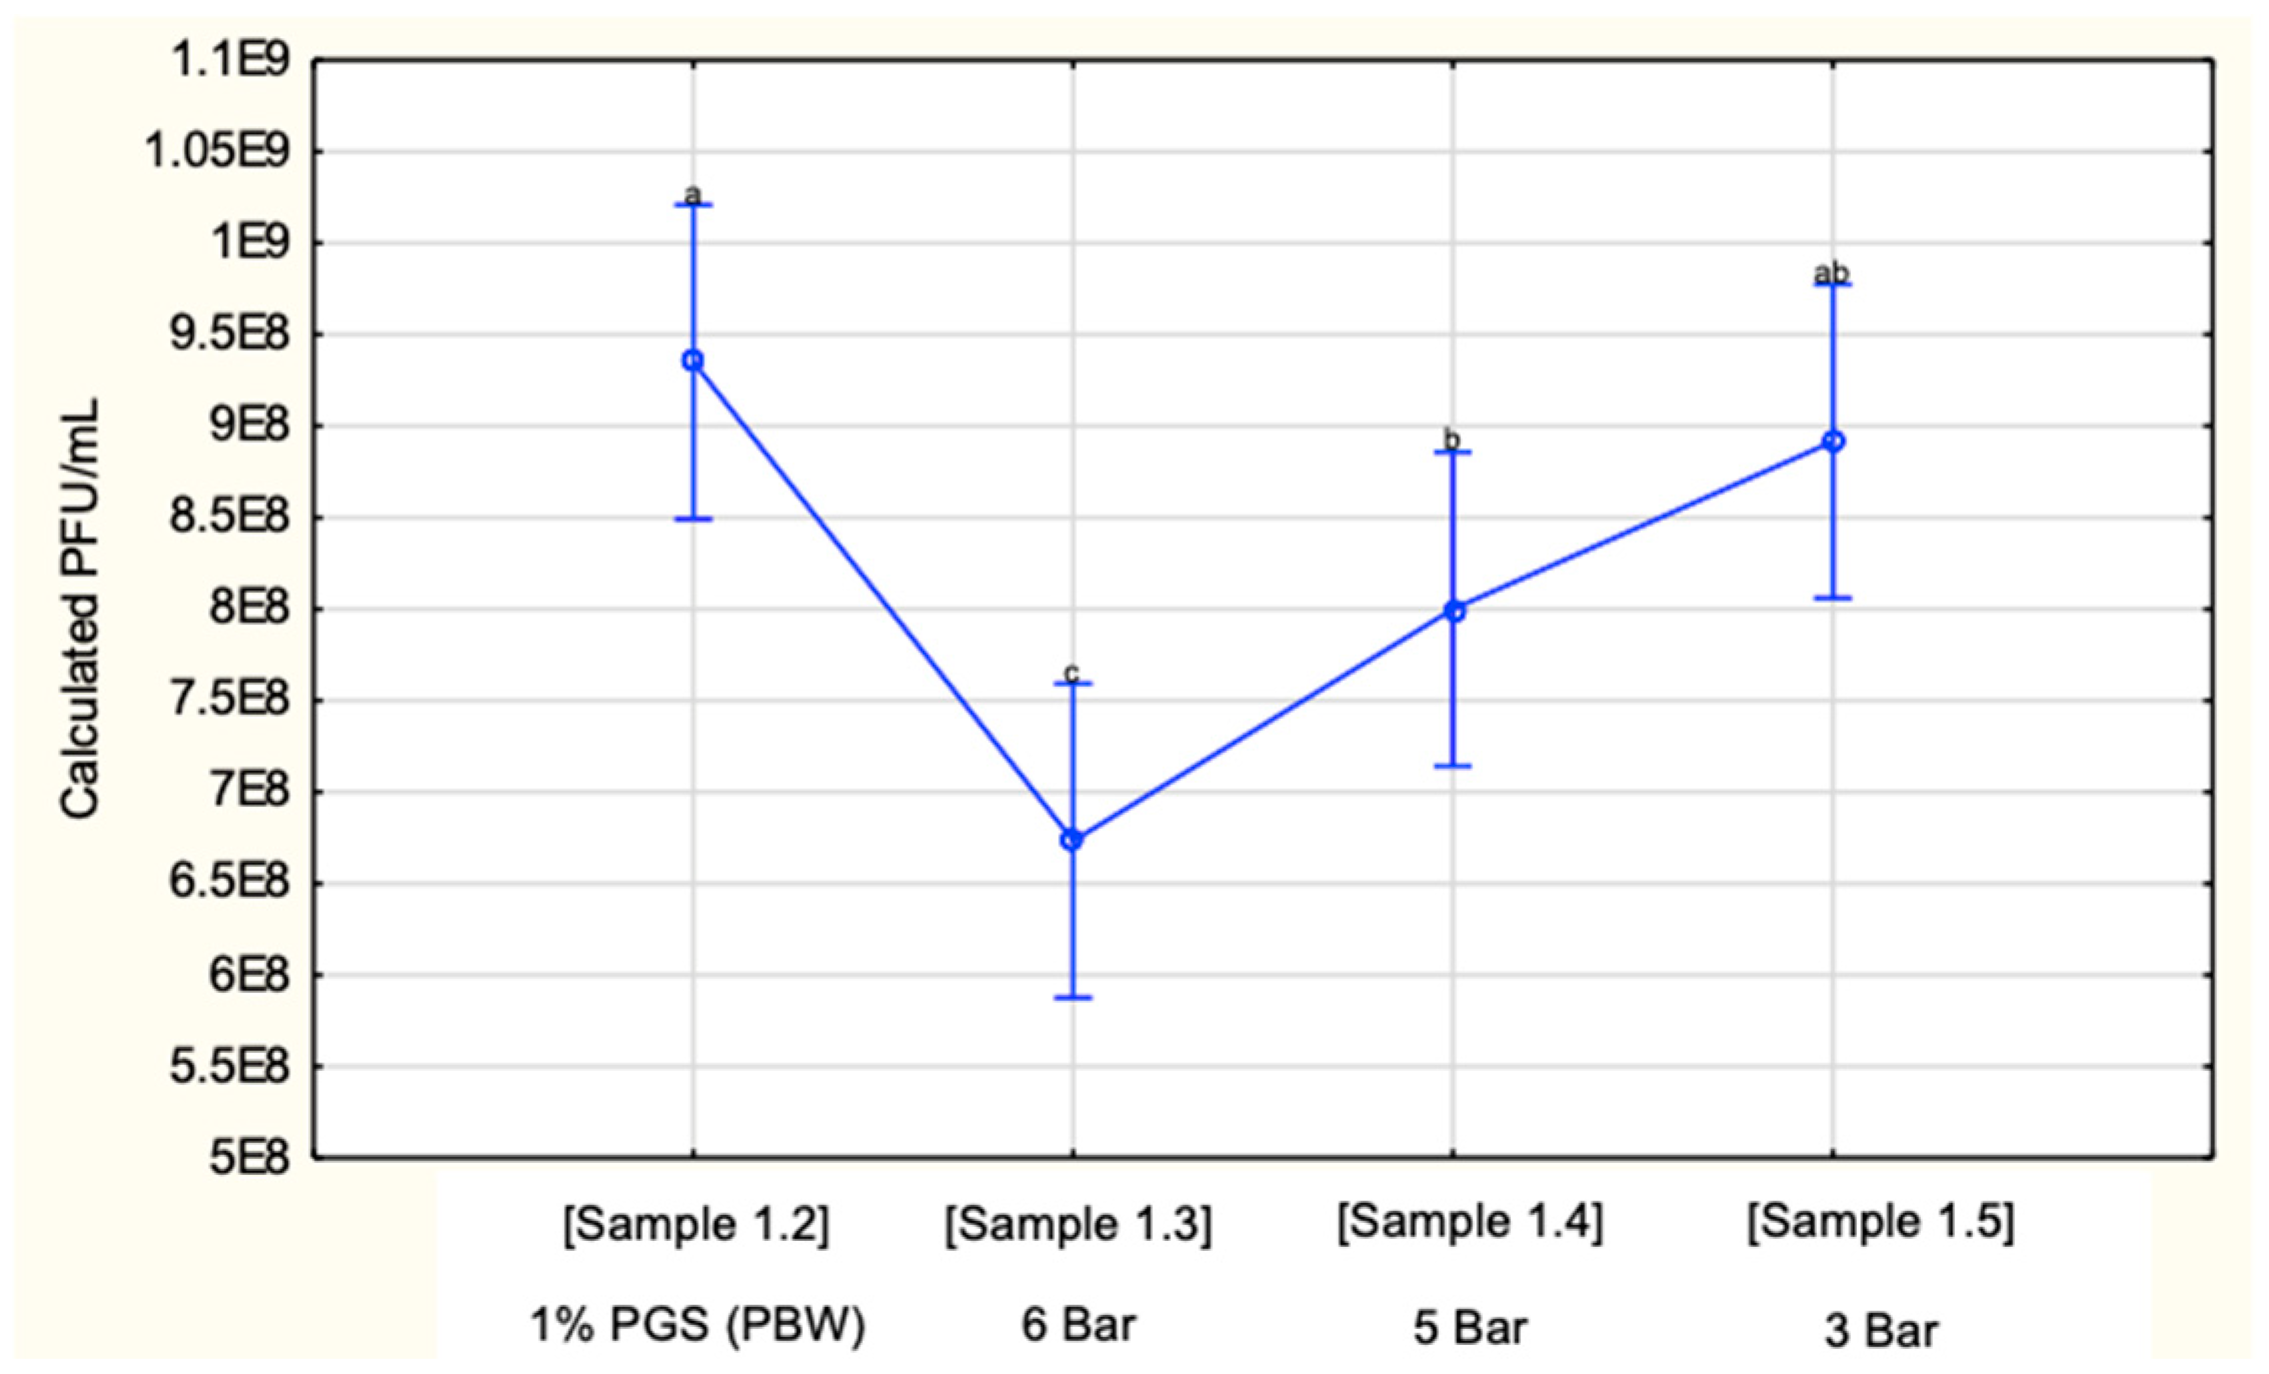
This investigated the survival of PGS diluted to 1% in PBW (4 ppm chlorine). It was then run through the spray system using a 200 mesh strainer, 530 μm nozzle diameter at pressures of 3, 5 and 6 Bar. This sought to investigate, briefly first, whether the water type influenced the phage stability—this was reflected in sample 1.2 (Figure 2). In addition, secondly, the combined effect of water type with the pressure and nozzle combination, this can be seen in samples 1.3–5 (Figure 3).
Sample 1.1. (100%) PGS had an average PFU/mL of 2.82 × 10¹¹, which is close to the expected ≈2 × 10¹¹ PFU/mL. This shows that there were no flaws in the batch of PGS selected for this analysis, confirming the validity of sample 1.1 as the control sample. If the packaging had been tampered with or if the refrigerated (4 °C) storage conditions had not been adhered to, this would show a decreased PFU/mL (<2 × 10¹¹) for the titration of the 100% PGS solution (sample 1.1). Jończyk-Matysiak et al. [17] support this, reiterating that storage conditions can cause variation in phage titers and, subsequently, could even hinder the infectivity of the phages. Fister et al. [18] highlight that phage stability is diverse and not always well understood, but that there is sufficient evidence that temperature fluctuations have an effect on a large number of types of phages [19]. This can be seen in a study whereby the reduction of L. monocytogenes decreased to a minimal level at 20 °C by phage P100 over a period of 17 weeks [18]. It is also not unusual that sample 1.1 had more than the expected 2 × 10¹¹ PFU/mL. González-Menéndez et al. [20] noted that phage propagation constitutes an adsorption step, inhibition of host genetics and progeny. Depending on the time period of each of these steps, and the number of phage particles that are produced per bacterial host cell, will determine the yield of phages [20]. Chaudhry et al. [21] had a similar outcome in a control sample where the phage titer overcame the inoculum density by more than 10-fold after 48 h. Additionally, this also reassures us that the producer potentially overestimated the concentration of phages to ensure sufficient counts at the end of the shelf-life of PhageGuard STM.
Sample 1.2 (1% PGS) showed a drastic decrease in PFU/mL to 9.35 × 10¹⁰. This highlights the negative impact the chlorine in the PBW had on the phage concentration compared to sample 1.1. The phage concentrations of samples 1.2 and 2.2 (Figure 4 where dH2O was used) differed to a large extent, however, not in a statistically significant manner (p = 0.18). Due to decreased stability and potential compromised structural integrity of the phage by the PBW, the authors observed that the combined effect of the pressures with the nozzle and mesh size was overall less significant (p = 0.045) for this analysis where PGS was diluted with PBW than overall for the PGS diluted with dH2O (p = 0.011) (Figure 5).
There were no significant differences observed between samples 1.5 and 1.2, and 1.5 and 1.4. This is represented by the common subscripts of “ab” and “a” (p = 0.48), and “ab” and “b” (p = 0.14), respectively. However, the closest sample to the target concentration (sample 1.2) is sample 1.5, where the pressure was 3 Bar. The 6 Bar pressure application yielded the largest significant difference to sample 1.2 (p < 0.01), and this is represented by the “c” subscript.
Sukumaran et al. [16] conducted a study that determined the stability of Salmonella lytic phages in different concentrations of chlorine to investigate what would be suitable for a sequential application. This was performed by diluting the phage solution to 1% (approx. 109 PFU/mL) in SM buffer. The 5 ppm chlorine solution was prepared from stock sodium hypochlorite being added to the 1% phage solution. The combined solution was then stored at 4 °C for 24 h before the phage titer was determined using the soft agar overlay method. It was found that the 5 ppm chlorine completely inactivated the phage. The PBW in this study did not completely inactivate the phage as in the study by Sukumaran et al. [16], only decreased the phage concentration. This could be due to a few factors; the first is the storage time. In this study, the samples were titrated and renumerated immediately after the samples were collected, whereas Sukumaran et al. stored the samples for 24 h. Furthermore, Micreos Food Safety (The Netherlands) stipulated that the PGS contains 4% potassium chloride (a neutral salt)—Langlet et al. [22] describe how phage concentrations decline at a lower pH (pH 3.9 and 2.5) as opposed to a neutral pH (7). Conversely, it can also be argued that the lower pH of the PBW (pH = 5–6) also plays a role in decreasing the phage concentrations, but not to such a large extent as the pH = 2.5–3.9 in the mentioned study. Furthermore, the salts of the PBW were taken into consideration; Mylon et al. [23] showed that higher concentrations of salts (1 M) were needed to cause aggregation of phages. In this study, the concentrations were less than 1 ppm, and so the authors speculate that the effect of the salts compared to that of the chloride was negligible.
Free chlorine influences the protein-mediated functions of a phage, namely, the injection of genetic material and subsequent replication in the bacterial host [24]. Essentially, the free chlorine reacts with amino acids that make up the capsid, leading to the formation of carbonyl products, which causes a change in the surface charge of the capsid (increased negativity), and a change in the overall molecular structure [19]. Thus, leading the authors to speculate that the change in molecular structure of the phages could be the reason for the lesser extent of impact by extrusion of the spray system on the calculated PFU/mL across samples 1.3–1.5. Further investigation is needed to confirm the validity of this finding.
Sano et al. [25] showed that there is a strong relationship between the rate of phage-inactivation due to chlorine and the concentration of these formed carbonyl groups. Furthermore, this chlorine-induced oxidation of the amino acids of the capsid causes a change in the surface electrostatic charge, as previously mentioned. This change affects the hydrophobicity of the structure. Chlorine thus affects the two pinnacle properties (hydrophobicity and electrostatic charge) that phages rely on for their function [26] and is regarded as viricidal [27].
This highlights the importance of monitoring the water content in an industrial setting, specifically free chlorine, which is to be used for phage application, as it can have an impact on phage stability and efficacy, especially before being applied via a spray system.
3.2. PGS Diluted to 1% with dH2O
The dilution of stock PGS from 100% to 1% in dH20 (samples 2.1–2.2) (Figure 4) did not decrease the calculated PFU/mL significantly (p = 0.73). Whereas the dilution using PBW saw a drop in calculated PFU/mL from 2.82 × 10¹¹ (sample 1.1) to 9.35 × 10¹⁰ (sample 1.2) (Figure 2) (p = 0.18). The PFU/mL of the 100% PGS (sample 2.1) was calculated to be 2.61 × 10¹¹ while the 1% PGS (sample 2.2) was calculated to be 2.31 × 10¹¹ (p = 0.7), highlighting no significant difference between the diluted phage solution and the undiluted phage solution. This set a strong precedent before being able to clearly show the effect of the pressure/nozzle combination on phage survival (Figure 5).
The calculated PFU/mL of sample 2.3 produced the lowest concentration of 1.66 × 10⁹ compared to sample 2.2 (which is considered the target concentration of 2.24 × 10⁹ PFU/mL) and this difference is represented by the subscripts “a” and “c” respectively (p = 0.00) (Figure 5). The mean concentrations of samples 2.2 and 2.5 do not differ significantly and share the common subscript of “a” (p = 0.09). Samples 2.2 and 2.4 differ significantly (but to a slightly lesser extent than between samples 2.2 and 2.3) and are represented by the subscripts “a” and “b” (p < 0.01) (Figure 5). This shows that a pressure of 3 Bar through the nozzle and mesh combination resulted in the highest phage survival and the closest result to that of the target concentration of sample 2.2. This also suggests that the pressures of 5 and 6 Bar through the nozzle and mesh combination have the effect of extrusion on the phage structure. Overall, with reference to both studies, Levene’s test for homogeneity of variances shows that PGS diluted with dH2O (Figure 5) is impacted more by the spray parameters (p = 0.01) than the PGS diluted with PBW (p = 0.045) (Figure 3).
In order to better understand what could have taken place, it is important to consider both the spray system pressure, strainer and nozzle, and the structure of a phage (Figure 6).
To our knowledge, there is no information on the effect of nozzle diameter, strainer, and pressure on phage survival through a spray system. The average size of a phage is approximately 0.05 × 0.02 µm [1], while the nozzle diameter used in this study is 530 μm (13,082) and the mesh size (200) are 74 μm × 75 μm (Spray Systems Co., Smyrna, TN, USA, 2018). The structure of a phage is complex, consisting of a capsid head containing phage DNA and a tail usually consisting of six fibers that are responsible for bacterial host attachment [28]. The highest pressure (6 Bar), coupled with the small nozzle and strainer size, could have caused extrusion on the structure of the phages, decreasing the output phage concentration (sample 2.3) (Figure 5). This proposed reason for decreased stability due to extrusion is further supported by the increased output phage concentration in sample 2.4 when the pressure was decreased to 5 Bar. In addition, in sample 2.5, where the pressure was decreased to 3 Bar, the output phage concentration was the highest of all the throughputs. These findings are simplified and represented as a % survival of the different solutions through the spray system (Table 3). It can be seen that PGS diluted with distilled water and a pressure of 3 Bar produced an 85.5% survival rate, while a pressure of 6 Bar showed that only 63.74% of the phages survived.
There are two specific phages that make up the PGS solution, namely, S16 and FO1a. S16 has a long tail fiber (LTF) with an intricate protein makeup (Gp38 adhesin attached to a Gp37 trimer) for binding to Salmonella. S16 has a contractile tail (a characteristic of the family Myoviridae). Its head is approximately 117 nm in length and 91 nm in width, while its tail is about 120 nm in length. It thus falls into the A2 group [29]. FO1a is a member of the A1 group of the family Myoviridae with an icosahedral head (73 nm in diameter) and a contractile tail (17 × 113 nm) which terminates in 6 straight tail fibers [30] (Figure 6). Irrespective of structure, the primary step of phage replication is infection. Adsorption of the phage into the bacterial host is triggered by the binding of the phage tail fibers to the receptor proteins on the surface of the bacterial cell. This is followed by DNA release into the host cytoplasm via penetration [31]. It is unclear exactly what part of the phage structure may be affected by the force of extrusion, but it is likely that the structural integrity of the long tail fibers of FO1a and S16 may be compromised or the large head of S16, but further molecular studies would need to be conducted on this to be sure.
4. Conclusions
It was found that the chlorine content of PBW (4 ppm chlorine) used to prepare a 1% PGS solution decreased phage concentration from 2.82 × 10¹¹ PFU/mL to 9.35 × 10¹⁰ PFU/mL (p = 0.18). This is not new information as there have been numerous studies that have been conducted which have proven that chlorine decreases phage concentration. However, this information is still valuable as there haven’t been any studies that have investigated the combined effect of chlorine-containing water with a subsequent spray application (extrusion). This study is also applicable in the sense that most processing plants make use of waste-water treatment plants, which often incorporate chlorine in the water for re-use in the processing environment.
The subsequent spray application of the diluted PGS in PBW at pressures of 3, 5, and 6 Bar had an overall lower significant difference (p = 0.045) generated by Levene’s Test for homogeneity of variances compared to the PGS diluted in dH2O (p = 0.011).
In terms of the effect of extrusion by the spray system on the phage concentration, this is most evident in the second analysis where the PGS was diluted in dH2O. This is because the dH2O did not significantly decrease the phage concentration (p = 0.73) prior to spray application. A pressure of 6 Bar decreased the output concentration of phages the most (p = 0.00), while a pressure of 3 Bar decreased the output concentration of phages the least (p = 0.09).
Thus, if the inlet water content has no chlorine, the ideal spray parameters for phage stability (from this study) are a 3 Bar pressure on a diaphragm pump, in combination with a 200 mesh strainer and a 530 μm nozzle diameter.
Some future research recommendations would entail the testing of different nozzle diameters, strainers, and pressure combinations. It would also be valuable to recommend to the industry that inlet water contents for phage dilutions, specifically free chlorine contents, should be closely monitored and that sufficient rinsing should take place after sanitizing protocols and before phage use.
Author Contributions
Conceptualization by K.W. and P.G. Methodology and validation by K.W. Writing—original draft preparation by K.W. Writing—review and editing, by P.G. and D.R. Visualization by P.G. and K.W. Funding acquisition by P.G. Supervision and project administration by D.R. and P.G. All authors have read and agreed to the published version of the manuscript.
Funding
This research received no external funding.
Institutional Review Board Statement
This study was approved by the Stellenbosch University Research Ethics Committee: Biosafety and Environmental Ethics (REC:BES), approval number BEE-2020-14681.
Informed Consent Statement
No human subjects were involved in this study.
Conflicts of Interest
The authors declare no conflict of interest.
References
- Hagens, S.; Loessner, M.J. Bacteriophage for biocontrol of foodborne pathogens: Calculations and considerations. Curr. Pharm. Biotechnol. 2010, 11, 58–68. [Google Scholar] [CrossRef] [PubMed]
- Endersen, L.; Coffey, A. The use of bacteriophages for food safety. Curr. Opin. Food Sci. 2020, 36, 1–8. [Google Scholar] [CrossRef]
- Wessels, K.; Rip, D.; Gouws, P. Salmonella in Chicken Meat: Consumption, Outbreaks, Characteristics, Current Control Methods and the Potential of Bacteriophage Use. Foods. Foods 2021, 10, 1742. [Google Scholar] [CrossRef] [PubMed]
- Berry, E.M.; Dernini, S.; Burlingame, B.; Meybeck, A.; Conforti, P. Food security and sustainability: Can one exist without the other? Public Health Nutr. 2015, 18, 2293–2302. [Google Scholar] [CrossRef]
- Thapa, S.P.; Shrestha, S.; Anal, A.K. Addressing the antibiotic resistance and improving the food safety in food supply chain (farm-to-fork) in Southeast Asia. Food Control 2020, 108, 106809. [Google Scholar] [CrossRef]
- Shannon, R.; Radford, D.R.; Balamurugan, S. Impacts of food matrix on bacteriophage and endolysin antimicrobial efficacy and performance. Crit. Rev. Food Sci. Nutr. 2020, 60, 1631–1640. [Google Scholar] [CrossRef] [PubMed]
- Moye, Z.D.; Woolston, J.; Sulakvelidze, A. Bacteriophage applications for food production and processing. Viruses 2018, 10, 205. [Google Scholar] [CrossRef] [Green Version]
- De Melo, A.G.; Levesque, S.; Moineau, S. Phages as friends and enemies in food processing. Curr. Opin. Biotechnol. 2018, 49, 185–190. [Google Scholar] [CrossRef]
- Yeh, Y.; Purushothaman, P.; Gupta, N.; Ragnone, M.; Verma, S.C.; De Mello, A.S. Bacteriophage application on red meats and poultry: Effects on Salmonella population in final ground products. Meat Sci. 2017, 127, 30–34. [Google Scholar]
- Huang, C.; Shi, J.; Ma, W.; Li, Z.; Wang, J.; Li, J.; Wang, X. Isolation, characterization, and application of a novel specific Salmonella bacteriophage in different food matrices. Food Res. Int. 2018, 111, 631–641. [Google Scholar] [CrossRef]
- Ahmadi, H.; Barbut, S.; Lim, L.T.; Balamurugan, S. Examination of the use of bacteriophage as an additive and determining its best application method to control Listeria monocytogenes in a cooked-meat model system. Front. Microbiol. 2020, 11, 779. [Google Scholar] [CrossRef] [PubMed]
- U.S. Food and Drug Administration. Food Additives Permitted for Direct Addition to Food for Human Consumption: Bacteriophage Preparation. 2006. Available online: http://edocket.access.gpo.gov/2006/E6-13621.htm (accessed on 22 May 2021).
- Health Canada. Policy on Listeria Monocytogenes in Ready-To-Eat Foods, Identification, Number: FD-FSNP 0071. 2011. Available online: http://www.hc-sc.gc.ca/fn-an/legislation/pol/policy_listeria_monocytogenes_2011-eng.php (accessed on 22 May 2021).
- Reinhard, R.G.; Kalinowski, R.M.; Bodnaruk, P.W.; Eifert, J.D.; Boyer, R.R.; Duncan, S.E.; Bailey, R.H. Practical application of bacteriophage in food manufacturing facilities for the control of Listeria sp. J. Food Saf. 2020, e12871. [Google Scholar] [CrossRef]
- Soffer, N.; Woolston, J.; Li, M.; Das, C.; Sulakvelidze, A. Bacteriophage preparation lytic for Shigella significantly reduces Shigella sonnei contamination in various foods. PLoS ONE 2017, 12, e0175256. [Google Scholar]
- Sukumaran, A.T.; Nannapaneni, R.; Kiess, A.; Sharma, C.S. Reduction of Salmonella on chicken meat and chicken skin by combined or sequential application of lytic bacteriophage with chemical antimicrobials. Int. J. Food Microbiol. 2015, 207, 8–15. [Google Scholar] [CrossRef]
- Jończyk-Matysiak, E.; Łodej, N.; Kula, D.; Owczarek, B.; Orwat, F.; Międzybrodzki, R.; Neuberg, J.; Bagińska, N.; Weber-Dąbrowska, B.; Górski, A. Factors determining phage stability/activity: Challenges in practical phage application. Expert Rev. Anti-Infect. Ther. 2019, 17, 583–606. [Google Scholar] [CrossRef]
- Fister, S.; Robben, C.; Witte, A.K.; Schoder, D.; Wagner, M.; Rossmanith, P. Influence of environmental factors on phage–bacteria interaction and on the efficacy and infectivity of phage P100. Front. Microbiol. 2016, 7, 1152. [Google Scholar] [CrossRef]
- Brié, A.; Gantzer, C.; Boudaud, N.; Bertrand, I. The impact of chlorine and heat on the infectivity and physicochemical properties of bacteriophage MS2. FEMS Microbiol. Ecol. 2018, 94, fiy106. [Google Scholar] [CrossRef]
- González-Menéndez, E.; Arroyo-López, F.N.; Martínez, B.; García, P.; Garrido-Fernández, A.; Rodríguez, A. Optimizing propagation of Staphylococcus aureus infecting bacteriophage vB_sauM-phiIPLA-RODI on Staphylococcus xylosus using response surface methodology. Viruses 2018, 10, 153. [Google Scholar] [CrossRef] [Green Version]
- Chaudhry, W.N.; Concepcion-Acevedo, J.; Park, T.; Andleeb, S.; Bull, J.J.; Levin, B.R. Synergy and order effects of antibiotics and phages in killing Pseudomonas aeruginosa biofilms. PLoS ONE 2017, 12, e0168615. [Google Scholar]
- Langlet, J.; Gaboriaud, F.; Gantzer, C. Effects of pH on plaque forming unit counts and aggregation of MS2 bacteriophage. J. Appl. Microbiol. 2007, 103, 1632–1638. [Google Scholar] [CrossRef]
- Mylon, S.E.; Rinciog, C.I.; Schmidt, N.; Gutierrez, L.; Wong, G.C.; Nguyen, T.H. Influence of salts and natural organic matter on the stability of bacteriophage MS2. Langmuir 2010, 26, 1035–1042. [Google Scholar] [CrossRef] [PubMed]
- Wigginton, K.R.; Pecson, B.M.; Sigstam, T.; Bosshard, F.; Kohn, T. Virus inactivation mechanisms: Impact of disinfectants on virus function and structural integrity. Environ. Sci. Technol. 2012, 46, 12069–12078. [Google Scholar] [CrossRef] [PubMed]
- Sano, D.; Ohta, T.; Nakamura, A.; Nakagomi, T.; Nakagomi, O.; Okabe, S. Culture-independent evaluation of nonenveloped-virus infectivity reduced by free-chlorine disinfection. Appl. Environ. Microbiol. 2015, 81, 2819–2826. [Google Scholar] [CrossRef] [PubMed] [Green Version]
- Loison, P.; Majou, D.; Gelhaye, E.; Boudaud, N.; Gantzer, C. Impact of reducing and oxidizing agents on the infectivity of Qβ phage and the overall structure of its capsid. FEMS Microbiol. Ecol. 2016, 92, fiw153. [Google Scholar] [CrossRef] [Green Version]
- Bloomfield, S.F.; Smith-Burchnell, C.A.; Dalgleish, A.G. Evaluation of hypochlorite-releasing disinfectants against the human immunodeficiency virus (HIV). J. Hosp. Infect. 1990, 15, 273–278. [Google Scholar] [CrossRef]
- Mansour, N. Bacteriophages are a natural gift, could we pay further attention! J. Food Microbiol. 2017, 1, 1–22. [Google Scholar]
- Marti, R.; Zurfluh, K.; Hagens, S.; Pianezzi, J.; Klumpp, J.; Loessner, M.J. Long tail fibres of the novel broad-host-range T-even bacteriophage S 16 specifically recognize Salmonella OmpC. Mol. Microbiol. 2013, 87, 818–834. [Google Scholar] [CrossRef]
- Whichard, J.M.; Weigt, L.A.; Borris, D.J.; Li, L.L.; Zhang, Q.; Kapur, V.; Pierson, F.W.; Lingohr, E.J.; She, Y.M.; Kropinski, A.M.; et al. Complete genomic sequence of bacteriophage Felix O1. Viruses 2010, 2, 710–730. [Google Scholar] [CrossRef]
- Loh, B.; Kuhn, A.; Leptihn, S. The fascinating biology behind phage display: Filamentous phage assembly. Mol. Microbiol. 2019, 111, 1132–1138. [Google Scholar] [CrossRef] [Green Version]
Figure 1.
Schematic representation of a titration of a 1% PGS sample.

Figure 2.
Calculated PFU/mL before and after dilution to 1% (PBW) (samples 1.1. and 1.2., respectively). * To draw parallels between sample counts of 1.1 and 1.2, sample 1.2 (1% dilution = 9.35 × 10⁸) was calculated to reflect a theoretical stock concentration (undiluted).
Figure 2.
Calculated PFU/mL before and after dilution to 1% (PBW) (samples 1.1. and 1.2., respectively). * To draw parallels between sample counts of 1.1 and 1.2, sample 1.2 (1% dilution = 9.35 × 10⁸) was calculated to reflect a theoretical stock concentration (undiluted).

Figure 3.
Calculated PFU/mL of 1% PGS (PBW) before being sprayed (sample 1.2) through the mesh (200) and nozzle (530 μm) at pressures of 6, 5, and 3 Bar (sample 1.3–1.5).
Figure 3.
Calculated PFU/mL of 1% PGS (PBW) before being sprayed (sample 1.2) through the mesh (200) and nozzle (530 μm) at pressures of 6, 5, and 3 Bar (sample 1.3–1.5).

Figure 4.
Calculated PFU/mL before and after dilution to 1% (dH2O) (samples 2.1 and 2.2, respectively). * To draw parallels between sample counts of 2.1 and 2.2, sample 2.1 (1% dilution = 2.31 × 10⁹) was calculated to reflect a theoretical stock concentration (undiluted).
Figure 4.
Calculated PFU/mL before and after dilution to 1% (dH2O) (samples 2.1 and 2.2, respectively). * To draw parallels between sample counts of 2.1 and 2.2, sample 2.1 (1% dilution = 2.31 × 10⁹) was calculated to reflect a theoretical stock concentration (undiluted).

Figure 5.
Calculated PFU/mL of 1% PGS (dH2O) before being sprayed (sample 2.2) through the mesh (200) and nozzle (530 μm) at pressures of 6, 5 and 3 Bar (sample 2.3–2.5).
Figure 5.
Calculated PFU/mL of 1% PGS (dH2O) before being sprayed (sample 2.2) through the mesh (200) and nozzle (530 μm) at pressures of 6, 5 and 3 Bar (sample 2.3–2.5).

Figure 6.
Basic phage structure with an icosahedral head, contractile tail terminating in 6 tail fibers, representative of the FO1a phage.
Figure 6.
Basic phage structure with an icosahedral head, contractile tail terminating in 6 tail fibers, representative of the FO1a phage.


Table 1.
Contents of prepared bottled water (ppm) (pH = 5–6) used to prepare the 1% PGS solution.
| Compound | Concentration (ppm) |
|---|---|
| Salt | 0.007 |
| Potassium | 0.5 |
| Chloride | 4 |
| Calcium | 0.62 |
| Magnesium | 0.5 |
| Fluoride | 0.1 |
| Sulphate | 1 |
| Calcium carbonate | 0.8 |
| Nitrate | 0.89 |
Table 2.
Summary of sample plan repeated in triplicate for 1% PGS (PBW) outputs through the spray system.
Table 2.
Summary of sample plan repeated in triplicate for 1% PGS (PBW) outputs through the spray system.
| Sample Information | Dilution | Pump Pressure (Bar) |
|---|---|---|
| Sample 1.1 10 mL PGS stock | 100% | N/A |
| Sample 1.2 25 mL 1% PGS pre-spray | 1 % | N/A |
| Sample 1.3 25 mL 1% PGS post-spray | 1% | 6 |
| Sample 1.4 25 mL 1% PGS post-spray | 1% | 5 |
| Sample 1.5 25 mL 1% PGS post-spray | 1% | 3 |
Table 3.
PGS concentrations summarized in the form of calculated % survival.
| PBW | dH2O | ||
|---|---|---|---|
| Sample | % Survival | Sample | % Survival |
| 1.1 (stock) | 100 | 2.1 (stock) | 100.00 |
| 1.2 (1%) | 33.16 | 2.2 (1%) | 88.16 |
| 1.3 (6 Bar) | 23.88 | 2.3 (6 Bar) | 63.74 |
| 1.4 (5 Bar) | 28.37 | 2.4 (5 Bar) | 77.10 |
| 1.5 (3 Bar) | 31.62 | 2.5 (3 Bar) | 85.50 |
Publisher’s Note: MDPI stays neutral with regard to jurisdictional claims in published maps and institutional affiliations. |
© 2022 by the authors. Licensee MDPI, Basel, Switzerland. This article is an open access article distributed under the terms and conditions of the Creative Commons Attribution (CC BY) license (https://creativecommons.org/licenses/by/4.0/).
Share and Cite
MDPI and ACS Style
Wessels, K.; Rip, D.; Gouws, P. The Effect of Spray Parameters on the Survival of Bacteriophages. Processes 2022, 10, 673. https://doi.org/10.3390/pr10040673
AMA Style
Wessels K, Rip D, Gouws P. The Effect of Spray Parameters on the Survival of Bacteriophages. Processes. 2022; 10(4):673. https://doi.org/10.3390/pr10040673
Chicago/Turabian StyleWessels, Kirsten, Diane Rip, and Pieter Gouws. 2022. "The Effect of Spray Parameters on the Survival of Bacteriophages" Processes 10, no. 4: 673. https://doi.org/10.3390/pr10040673
Note that from the first issue of 2016, this journal uses article numbers instead of page numbers. See further details here.